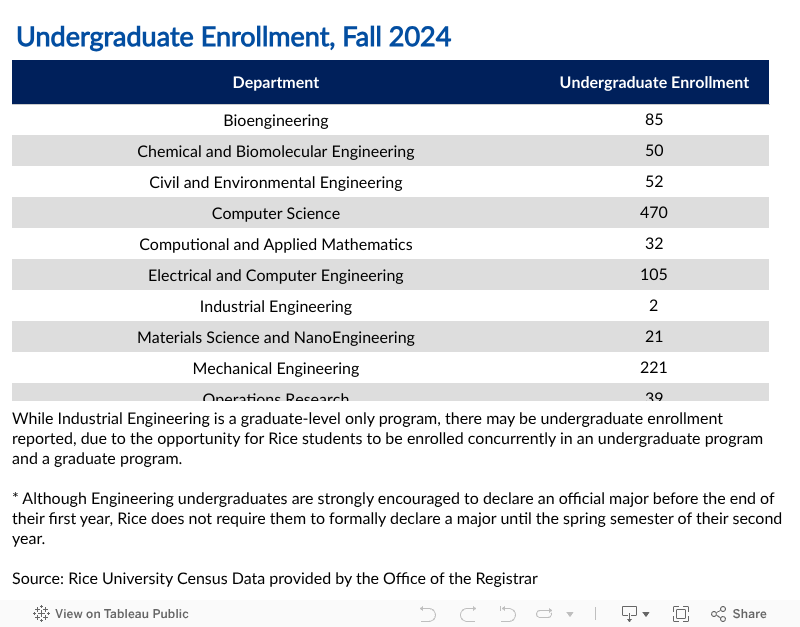
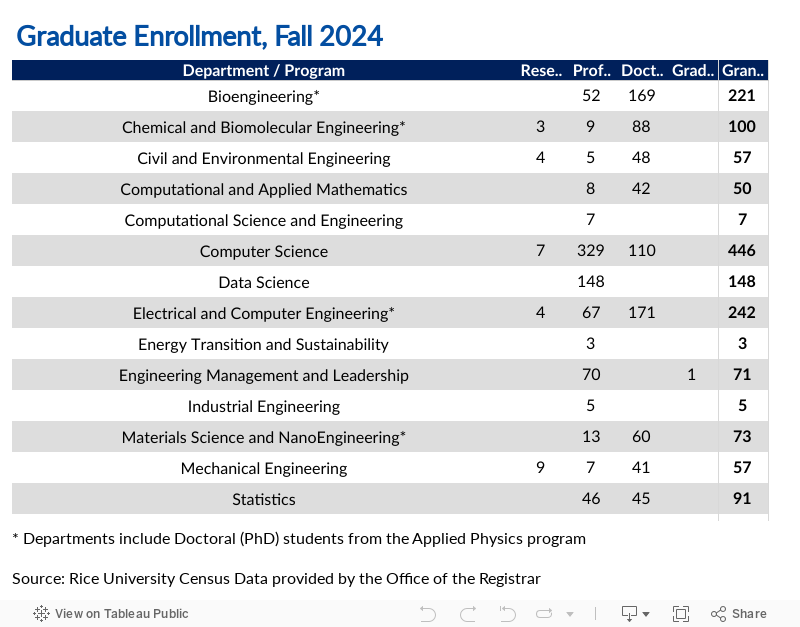
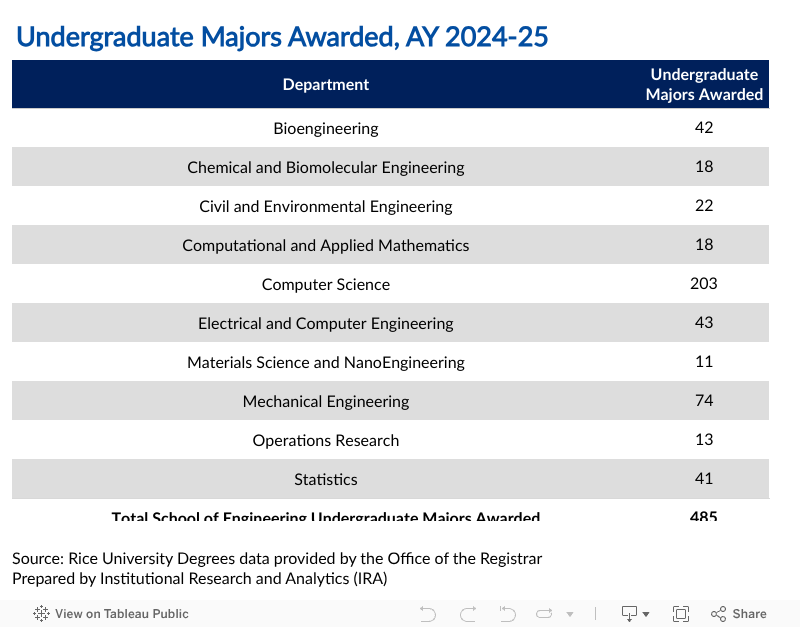
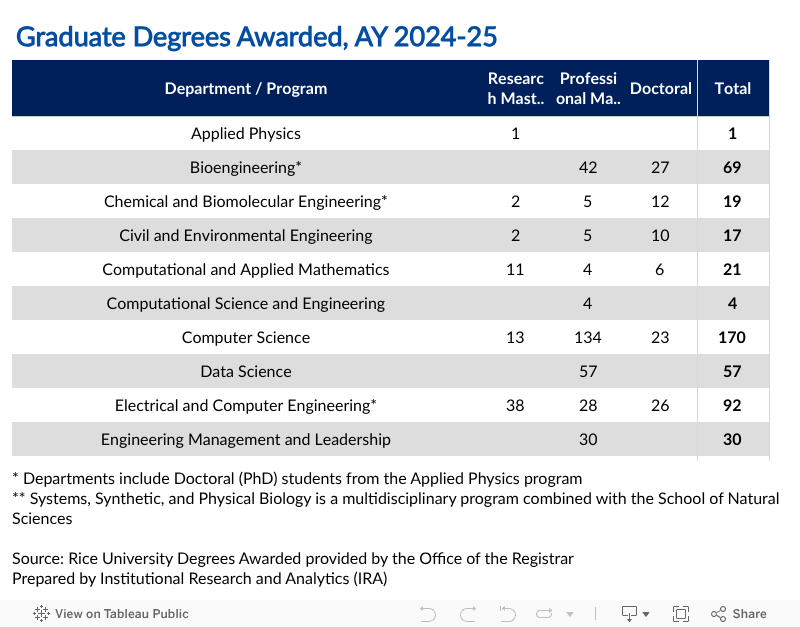
Undergraduate Enrollments, Fall 2022
Department | BA | BS | Undeclared Majors | Total |
---|---|---|---|---|
Bioengineering | 77* | 77 | ||
Chemical and Biomolecular Engineering | 57* | 57 | ||
Civil and Environmental Engineering | 3 | 32* | 35 | |
Computational and Applied Mathematics | 25 | 25 | ||
Computer Science | 190 | 203 | 393 | |
Electrical and Computer Engineering | 1 | 94** | 95 | |
Materials Science and NanoEngineering | 1 | 14* | 15 | |
Mechanical Engineering | 2 | 206* | 208 | |
Operations Research | 17 | 17 | ||
Statistics | 40 | 34 | 74 | |
Undeclared Majors*** | 591 | 591 | ||
Total School of Engineering Undergraduate Majors | 1,587 |
*BS degree programs that are accredited by the Engineering Accreditation Commission of ABET. The other BS and BA undergraduate programs are not accredited by the EAC of ABET.
**The program leading to the BSEE degree is accredited by the Engineering Accreditation Commission (EAC) of ABET, https://www.abet.org. The BSEE was renamed the BSECE degree in academic year 2022-23.
***Although Engineering undergraduates are strongly encouraged to declare an official major before the end of their first year, Rice does not require them to formally declare majors until the spring semester of their second year.
Source: Rice University Census Data provided by the Office of the Registrar
Graduate Enrollments, Fall 2022
Department | MS | PHD | Professional Masters | Total |
---|---|---|---|---|
Bioengineering* | 129 | 170 | ||
Chemical and Biomolecular Engineering* | 9 | 90 | 24 | 123 |
Civil and Environmental Engineering* | 4 | 43 | 6 | 53 |
Computational and Applied Mathematics | 29 | 36 | 65 | |
Computer Science* | 1 | 111 | 517 | 629 |
Electrical and Computer Engineering* | 2 | 188 | 37 | 227 |
Materials Science and NanoEngineering | 2 | 65 | 18 | 85 |
Mechanical Engineering | 14 | 38 | 8 | 60 |
Statistics* | 46 | 65 | 111 | |
Engineering Management and Leadership | 33 | 3 | ||
Total School of Engineering Graduate Majors | 32 | 794 | 785 | 1,611 |
* PhD students in these departments includes students in the Applied Physics program and the Systems, Synthetic, and Physical Biology (SSPB) programs.
Source: Rice University Census Data provided by the Office of the Registrar
Undergraduate Degrees Awarded, AY 2021-22
Department | BA | BS | Total |
---|---|---|---|
Bioengineering | 34* | 34 | |
Chemical and Biomolecular Engineering | 25* | 25 | |
Civil and Environmental Engineering | 3 | 20* | 23 |
Computational and Applied Mathematics | 13 | 13 | |
Computer Science | 74 | 47 | 121 |
Electrical and Computer Engineering | 4 | 45* | 49 |
Materials Science and NanoEngineering | 1 | 5* | 6 |
Mechanical Engineering | 1 | 59* | 60 |
Operations Research | 1 | 1 | |
Statistics | 29 | 4 | 33 |
Total School of Engineering Undergraduate Degrees Awarded | 365 |
*BS degree programs that are accredited by the Engineering Accreditation Commission of ABET. The other BS and BA undergraduate programs are not accredited by the EAC of ABET.
Source: Rice University Degrees Awarded provided by the Office of the Registrar
Graduate Degrees Awarded, AY 2021-22
Department | MA | MS | PhD | Professional Master's | Total |
---|---|---|---|---|---|
Bioengineering | 3 | 17 | 31 | 51 | |
Chemical and Biomolecular Engineering | 5 | 12 | 5 | 22 | |
Civil and Environmental Engineering | 5 | 9 | 2 | 16 | |
Computational and Applied Mathematics | 6 | 7 | 30 | ||
Computer Science | 8 | 6 | 62 | 76 | |
Data Science | 22 | 22 | |||
Electrical and Computer Engineering | 19 | 17 | 9 | 45 | |
Materials Science and NanoEngineering | 2 | 13 | 23 | ||
Mechanical Engineering | 11 | 10 | 7 | 28 | |
Statistics | 12 | 12 | 14 | 38 | |
Total School of Engineering Graduate Degrees Awarded | 18 | 52 | 105 | 173 | 348 |
*Includes students earning a Master's degree in Computational Science and Engineering
Source: Rice University Degrees Awarded provided by the Office of the Registrar